![]() I used to create my own logging mechanisms for my Windows Azure Cloud Services. For a while this was the perfect solution to my requirements. But It had a down side, it required cleanup routines and a bit of maintenance.
I used to create my own logging mechanisms for my Windows Azure Cloud Services. For a while this was the perfect solution to my requirements. But It had a down side, it required cleanup routines and a bit of maintenance.
In the recent months I changed my mind about Windows Azure Diagnostics and if you’re not too adventurous and don’t need your logs available every 30 seconds, I strongly recommend using them. They’ve come such a long way since the first versions that I’m now willing to wait the full minute for my application logs to get persisted to table storage.
The issues I had with Windows Azure Diagnostics were because of my ignorance and half because of irritating issues that used to exist.
- I didn’t know how to efficiently read from Windows Azure Diagnostics
- Changing Windows Azure Diagnostics configurations used to mean a new release (code changes and deployment)
Gaurav Mantri wrote an excellent blog post about an effective way of fetching diagnostics data from Windows Azure Diagnostics Table. In his post, Gaurav mentions that the table’s PartitionKey is UTC time ticks rounded to the minute. This is actually really practical! Because it means that we can query for multiple time spans in parallel.
Get Windows Azure Diagnostics Cloud Table Query
Using code from my post about querying over Windows Azure Table Storage Service I created the following example to demonstrate how to query Windows Azure Diagnostics using UTC ticks as the PartitionKey.
CloudTableQuery<TEntity>
where TEntity : ITableEntity, new()
{
private readonly string tableStartPartition;
private readonly string cacheKey;
private readonly string tableEndPartition;
public GetWindowsAzureDiagnostics(DateTime start, DateTime end)
{
tableStartPartition = "0" + start.ToUniversalTime().Ticks;
tableEndPartition = "0" + end.ToUniversalTime().Ticks;
var queryCacheHint = "GetWindowsAzureDiagnostics"
+ tableStartPartition
+ tableEndPartition;
cacheKey = queryCacheHint;
}
public override Task<ICollection<TEntity>> Execute(CloudTable model)
{
if (model == null)
throw new ArgumentNullException("model");
return Task.Run(() =>
{
var condition = MakePartitionKeyCondition();
var tableQuery = new TableQuery<TEntity>();
tableQuery = tableQuery.Where(condition);
return (ICollection<TEntity>)model.ExecuteQuery(tableQuery).ToList();
});
}
public override string GenerateCacheKey(CloudTable model)
{
return cacheKey;
}
private string MakePartitionKeyCondition()
{
var startTicks = tableStartPartition.ToUpperInvariant();
var partitionStarts = TableQuery.GenerateFilterCondition("PartitionKey",
QueryComparisons.GreaterThanOrEqual,
startTicks);
var endTicks = tableEndPartition.ToUpperInvariant();
var partitionEnds = TableQuery.GenerateFilterCondition("PartitionKey",
QueryComparisons.LessThanOrEqual,
endTicks);
return TableQuery.CombineFilters(partitionStarts, TableOperators.And, partitionEnds);
}
}
Using the GetWindowsAzureDiagnostics query
{
TimeSpan oneHour = TimeSpan.FromHours(1);
DateTime start = DateTime.UtcNow.Subtract(oneHour);
var query = new GetWindowsAzureDiagnostics<DynamicTableEntity>(start, DateTime.UtcNow);
return await TableStorageReader.Table("WADLogsTable").Execute(query);
}
Setting Up Windows Azure Diagnostics Configurations
From the Solution Explorer right click on the role’s definition located in the Clod Project.

Then select Properties.

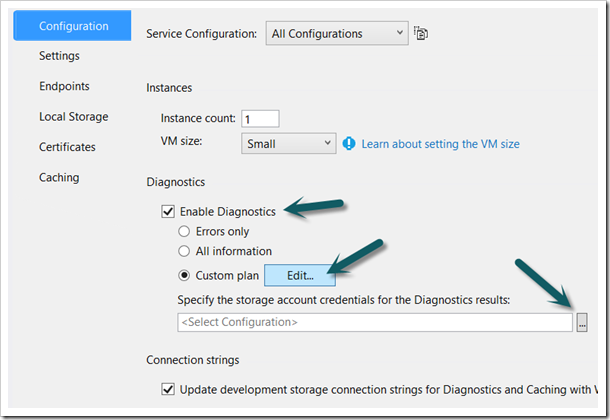
Enable Diagnostics and specify a storage account connection string. Be sure to use a separate account from you application’s production storage account. Each storage account has a target performance of 20,000 transactions per second, therefore using a different storage account will not penalize your application’s performance.
Click on the Edit button

Use this window to configure the application’s diagnostics.
Updating Windows Azure Diagnostics from Visual Studio’s Server Explorer
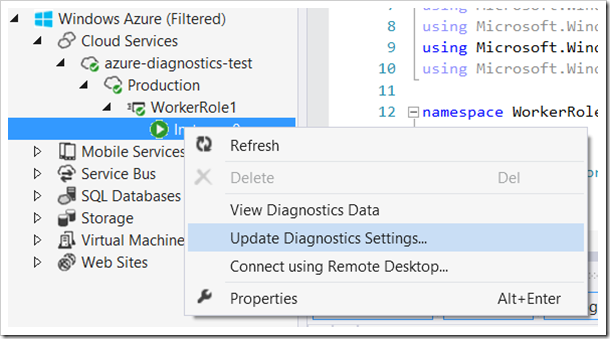
From the Server Explorer, select the Cloud Service role open the context menu.

From this menu, select Update Diagnostics Settings…

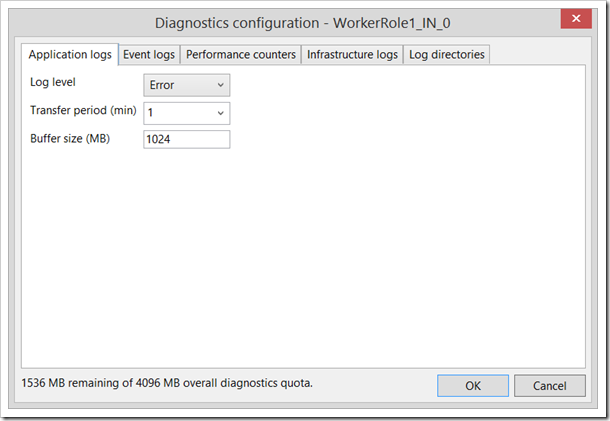
From this menu, you will be able to modify the current Windows Azure Diagnostics configurations. Clicking on Ok will update the role instances on Windows Azure with the new settings.
Next Steps
Once you’ve gathered Windows Azure Diagnostics for a little while, you will probably want to have a look. To accomplish this you have a couple options like third party tools. The Azure Management Studio can help you browse the Windows Azure Diagnostics data. On the other hand, if you need something more custom, you can use a method similar to the table storage query from this blog post. I usually query storage directly because I haven’t come across the perfect tool.
How do you work with Windows Azure Diagnostics data?
Filed under: Cloud Services, Microsoft Azure, Table Storage Tagged: C#, Cloud Services, Diagnostics, PartitionKey, Server Explorer, Table Storage, Ticks, UTC, Windows